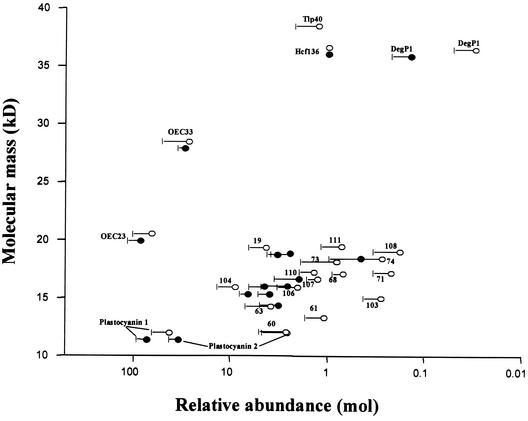
Figure 2.
Relative Expression Levels of Thylakoid Proteins in Pea and Arabidopsis.
Quantification of expression levels of lumenal and other thylakoid proteins from Arabidopsis proteins (closed symbols) and pea proteins (open symbols) calculated on a molar basis and normalized to the expression level of Hcf136. Duplicate Coomassie blue–stained and duplo silver-stained 2-D gels of two independent experiments with a pH range of 4 to 7 were analyzed. Standard errors (n = 4) are indicated, and the x axis is in log scale.

