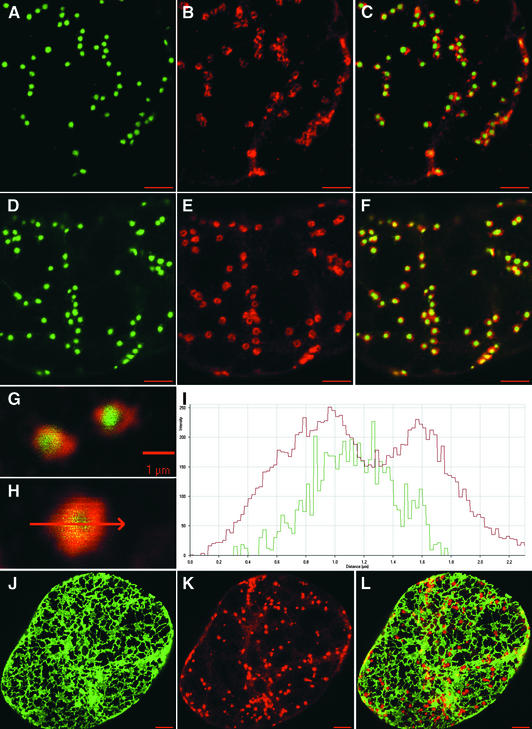
Figure 8.
Immunolocalization of γ-COP and Arf1p in GmMan1-GFP and GFP-HDEL BY-2 Cells.
(A) and (D) Typical distribution of Golgi stacks in the cortical cytoplasm of GmMan1-GFP cells.
(B) and (E) Corresponding immunofluorescence labeling with anti-Atγ-COP and anti-AtArf1p antibodies, respectively.
(C) and (F) Composite images obtained after merging (A) with (B) and (D) with (E), respectively.
(G) High magnification of two fluorescent Golgi stacks (green signal, GmMan1-GFP; red signal, Atγ-COP).
(H) High magnification of a single fluorescent Golgi stack (green signal, GmMan1-GFP; red signal, AtArf1p).
(I) Fluorescence profile along the arrow shown in (H). The y axis gives the intensity of the GmMan1-GFP signal (green curve) and of the AtArf1p signal (red curve) along the arrow. The x axis gives the distance in micrometers.
(J) Typical distribution of the cortical ER in the GFP-HDEL cells.
(K) Corresponding immunofluorescence labeling with anti-Atγ-COP.
(L) Merged images from (J) and (K).
All images were obtained by confocal microscopy from single optical sections through the cortical cytoplasm of tobacco BY2 cells. Bars = 5 μm except in (G) and (H).

