Figure 4.
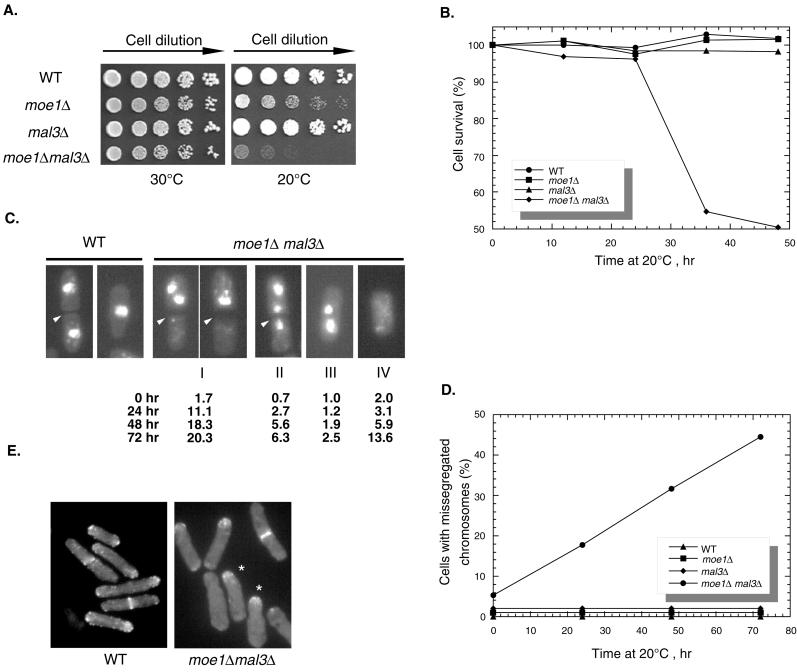
Phenotypes of mal3Δ moe1Δ cells. (A) Serial dilutions of cells (1:5) were spotted on YEAU plates. These plates were incubated at either 30°C for 3 d or at 20°C for 6 d before being photographed. (B) Cells (relevant genotypes are shown in the inset) were spread on plates (YEAU) and preincubated at 20°C for the indicated times and then transferred to 30°C. The colonies that emerged were counted. (C) moe1Δ mal3Δ cells pregrown at 30°C to log phase were shifted to 20°C for the indicated times, and the presence of missegregated chromosomes (groups I–IV) was revealed by 4′,6-diamidino-2-phenylindole (DAPI) staining. The percentages of these aberrant cells are indicated at the bottom of each panel. A wild-type cell that just completed separation (left) and one that was in interphase (right) are shown as controls. Arrowheads, positions of septa. (D) The percentages of three groups of cells with missegregated chromosomes, as shown in C (groups I–IV), are combined and plotted against time after being shifted to 20°C. (E) F-actin was revealed by rhodamine-conjugated phalloidin. *, moe1Δ mal3Δ cells that grew monopolarly with F-actin detected at only one end of the cell. Strains used were SP870 (WT, wild-type) and ME1UML3A (moe1Δ mal3Δ). In C and D more than 400 cells were examined at each time point.

