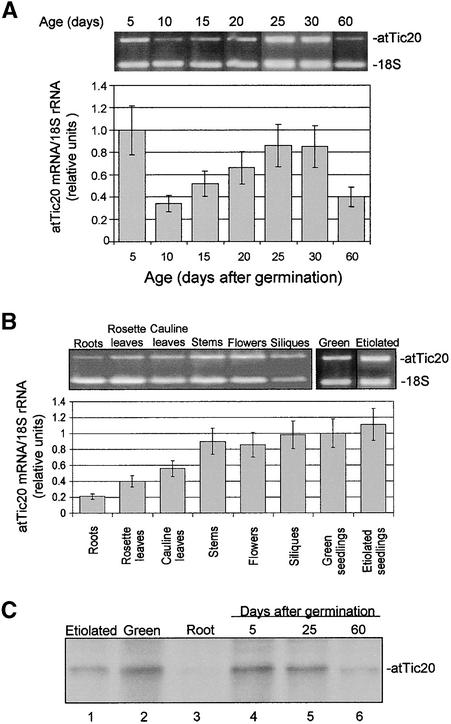
Figure 2.
Expression Pattern of atTic20.
(A) Temporal expression pattern of atTic20 mRNA. Total RNA was extracted from wild-type Arabidopsis plants at the ages indicated. The relative atTic20 mRNA levels were determined by comparative RT-PCR using 18S rRNA as the control (see Methods). The levels of atTic20 mRNA are expressed as the ratio of the ethidium bromide stain intensity of the atTic20 and 18S rRNA PCR products. atTic20 expression was highest during periods of rapid growth and declined as plants matured.
(B) Tissue distribution of atTic20 mRNA expression. Total RNA was extracted from the indicated tissues of 40-day-old light-grown or 5-day-old etiolated plants. The relative atTic20 mRNA level in each tissue was determined by comparative RT-PCR as described in (A). atTic20 mRNA was detected at varying levels in all tissues examined.
(C) Distribution of the atTic20 protein. Total membrane fractions (75 μg of protein each) from etiolated, green, and root tissues or green tissue harvested at the times indicated were resolved by SDS-PAGE, transferred to nitrocellulose, and immunoblotted with anti-atTic20 IgG. atTic20 protein was detected in all tissues examined, with the highest levels found in young green tissues. Error bars in (A) and (B) indicate ±sd.

