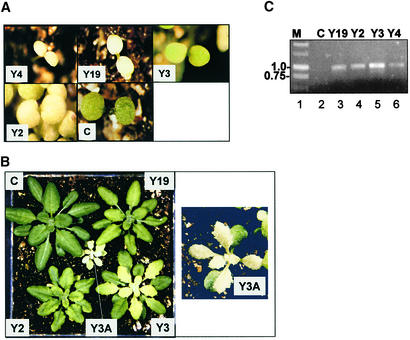
Figure 3.
Phenotypes of atTic20 Antisense Plants.
(A) Comparison of 5-day-old control (C), Y2, Y3, Y4, and Y19 antisense lines grown on soil. The Y4 and Y19 lines exhibit marked pale phenotypes at early stages of plant development, whereas the Y3 and Y2 lines are only slightly pale.
(B) Comparison of 40-day-old control (C), Y2, Y3, and Y19 antisense lines grown on soil. A 40-day-old Y3 plant homozygous for the atTic20 antisense gene (Y3A) is shown in the center of the left panel and shown enlarged 2.5 times at right. The true leaves of Y2, Y3, and Y19 antisense plants exhibit a variety of pale phenotypes and moderate growth defects. Y3 homozygous plants (Y3A) exhibit a severe pale phenotype and growth defect.
(C) Confirmation of antisense gene incorporation into the genome of lines exhibiting antisense phenotypes. Genomic DNA from the indicated antisense (Y19, Y2, Y3, andY4) and control (C) plants was extracted and subjected to PCR using primers p3300s and p3300a that are specific for regions of the pCAMBIA3300-1 vector flanking the atTic20 antisense gene. Lane 1 contains DNA molecular mass markers (M). The 1.0- and 0.75-kb markers are indicated at left.

