
Figure 6.
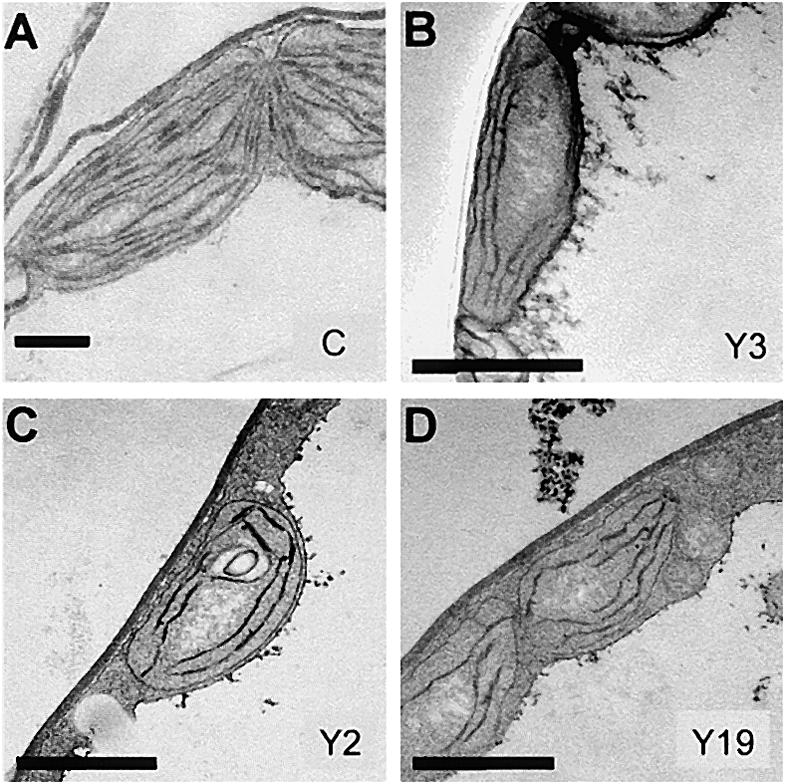
Ultrastructure of Chloroplasts from atTic20 Antisense Plants.
Control (A), Y3 (B), Y2 (C), and Y19 (D) antisense plants were grown on agar plates containing 1% Suc. Electron microscopic samples were prepared from the pale leaves of antisense plants and the corresponding green leaves of control plants of the same age. The antisense lines exhibited a decrease in thylakoid membrane development consistent with their pale phenotypes. Bars = 400 nm.