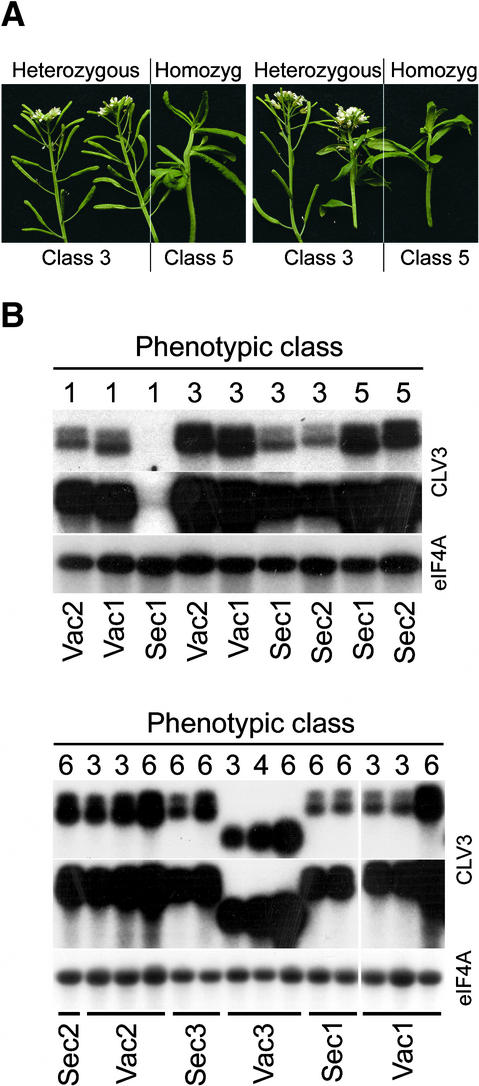
Figure 3.
The Extent of Meristem Termination Is Related Directly to Transgene Expression Level.
(A) Progeny from two independent primary transformants are shown. Eight weeks after kanamycin-resistant T2 plants were transplanted to soil, segregation of class 3 and class 5 phenotypes was observed. The T2 plants were genotyped by scoring the segregation of kanamycin resistance in their progeny (class 5 plants eventually set some seed). Plants with class 3 phenotypes were heterozygous for the transgene, whereas plants with class 5 phenotypes were homozygous.
(B) RNA gel blot analysis of transgene expression. Five micrograms of total RNA from rosette leaves of plants transformed with the CLV3 fusion constructs was hybridized with probes corresponding to CLV3 and eIF4A. Two different exposures of the hybridization with the CLV3 probe are shown (20 min and 2 hr). The mRNA abundance of the eIF4A transcript was used as a loading control. The top panel shows primary transformants in a clv3-2 background; the bottom panel shows primary transformants in the wild-type Columbia background. The phenotypic class of the plant is indicated at top, and the genotype is indicated at bottom. All constructs except for Vac3 contain the 3′ untranslated region of barley lectin and two transcription termination sites, which explains the larger transcript sizes and doublet bands in these lanes compared with the Vac3 lanes.

