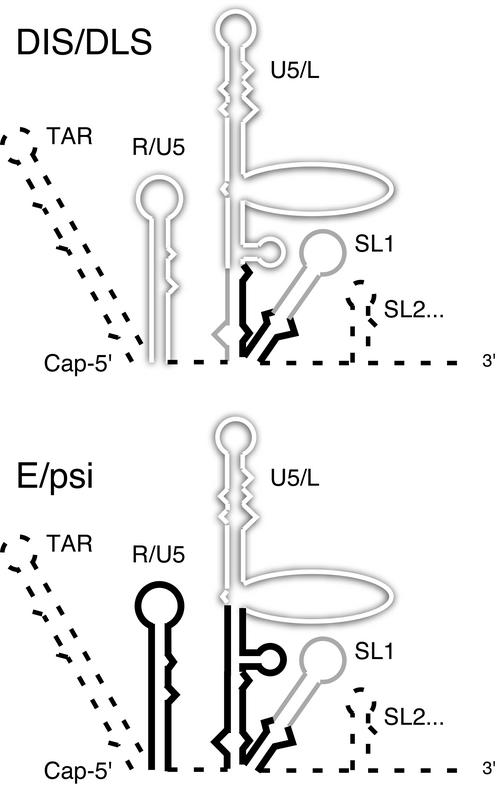
FIG. 6.
Functional mapping of the 5′ region of HIV-1. The functional maps of RNA dimerization (top) and genome packaging (bottom) are shown separately. The shadowed open lines represent the areas dispensable for each function. The solid bold lines represent the areas essential for each function. The shaded lines represent the areas important for efficient functions. The dashed lines represent the areas not yet analyzed.

