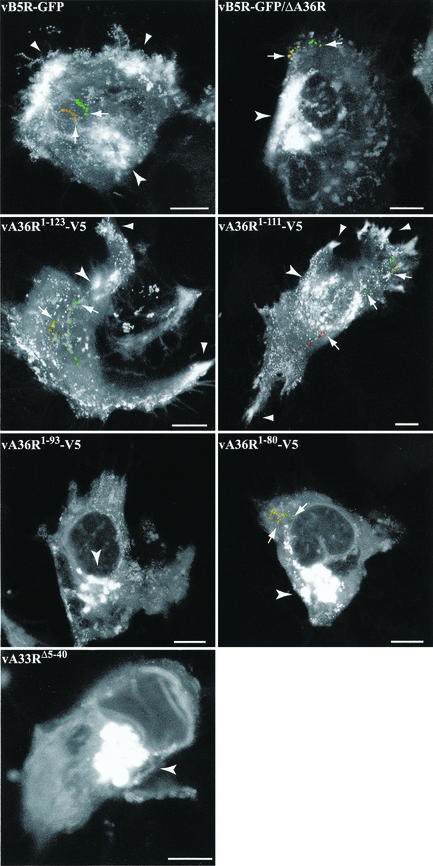
FIG. 8.
Maximum-intensity projections of time-lapse microscopy. HeLa cells were infected with 0.2 PFU of the indicated recombinant virus per cell and were incubated overnight. The next day, time-lapse series of images were collected at 1 frame per 6 s for 10 min. Series of images were analyzed by maximum-intensity projections and are shown as a single image. As examples, the same virions from the original series of images are colored in the projection to facilitate the interpretation. Arrows point to the first colored virion from the original series. Arrowheads denote the bright areas of IEV accumulation at the vertices of the cells. Concave arrowheads denote the juxtanuclear region. Bar, 10 μm.

