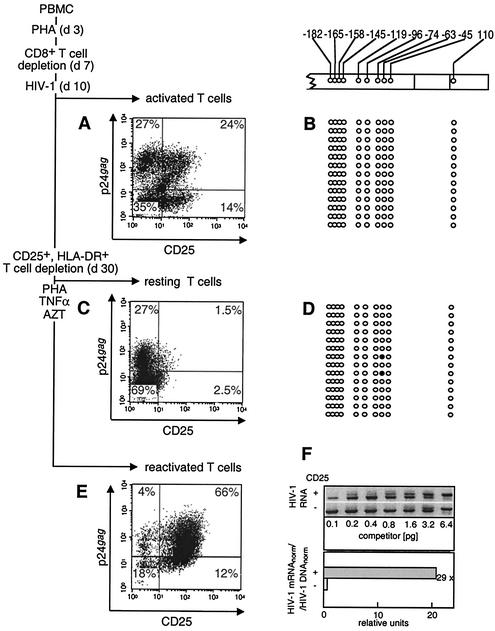
FIG. 3.
Expression of the HIV-1 genome and CpG methylation pattern in the LTR region in primary resting memory T cells infected in vitro. (A and B) PHA-activated PBMC infected with HIV-1 10 days after activation (d10). (C and D) The same culture that developed the resting memory phenotype 20 days later (d30). The depletion of CD25- and HLA-DR-positive cells was performed 30 days after PBMC activation. (E) Reactivation of HIV-1 production in resting memory T cells after their reactivation with PHA and TNF-α. (A, C, and E) The immunofluorescence of the p24gag- and CD25-labeled cells was determined in activated (A), resting (C), and reactivated (E) cells. Numbers at the corner of each quadrant are percentages of positive cells. The CpG methylation patterns of the LTR region in primary PHA-activated (B) and resting memory T (D) cells are shown. Open circles, nonmethylated CpG residues; closed circles, methylated CpG residues. (F) Quantitation of the transcriptional activity of the HIV-1 promoter in activated (CD25+) and resting (CD25−) T cells. (F, upper panel) Quantitative competitive RT-PCR with primers that recognize HIV-1 unspliced RNA, with indicated amounts of competitor RNA (14, 15). (F, lower panel) The bars show the relative quantity of HIV-1 transcripts normalized for the β-actin mRNA in the same sample (HIV-1 mRNAnorm) and standardized to the relative quantity of HIV-1 proviruses normalized for the β-globin DNA (HIV-1 DNAnorm). The overall ratio of HIV-1 mRNAnorm to HIV-1 DNAnorm in activated and resting T cells (29 in the example shown) indicates reduction of the transcriptional activity in resting memory T cells compared to activated cells.

