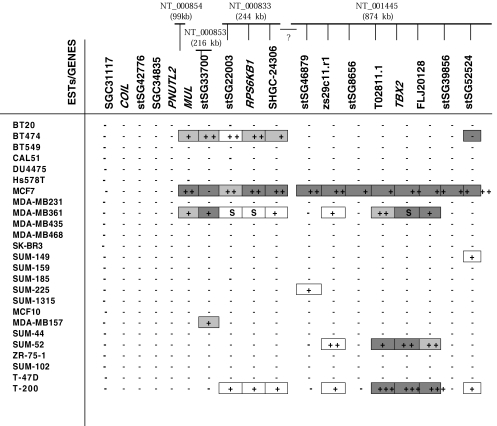
Figure 2.
Amplification and overexpression patterns of ESTs and genes in 24 breast cancer cell lines and one primary breast tumor sample (T-200) (detected by semiquantitative duplex PCR and semiquantitative duplex RT-PCR except the boxes marked as “S” that are detected only by Southern blot analysis). Markers in the databases are listed proximal to distal on 17q23 based on the physical map of Monni et al. [17]. The screened contigs in the databases are shown at the top of corresponding EST/gene names. Plus sign (+) indicates the level of amplification; +:2 to 2.5-fold, + +: 2.5 to 5-fold, + + +: more than 5-fold, S: amplification detected only by Southern analysis. Light gray box ( ) indicates overexpression 1.0 to 2.5 times. Darker gray box (■) indicates overexpression more than 2.5 times. Minus sign (-) indicates no amplification and no overexpression. Gap between the contigs is marked with a question mark.

