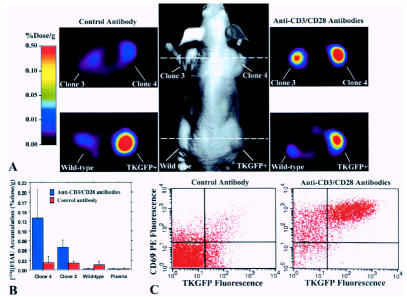
Figure 5.
Imaging NFAT-TKGFP reporter system activity with [124I]FIAU and PET and assessments in tissue samples. Photographic image of a typical mouse bearing different s.c. infiltrates (middle panel); transaxial PET images of TKGFP expression in a mouse treated with control antibody (left panel) and anti-CD3/CD28 antibodies (right panel) were obtained at the levels indicated by the dashed lines (A). [124I]FIAU accumulation (%dose/g) in tissue samples of the Jurkat/dcmNFATtgn clone 3 and 4 infiltrates, wild-type Jurkat infiltrates, and blood plasma, obtained after PET imaging (B). FACS profiles of TKGFP and CD69 expression in a tissue sample from the same Jurkat/dcmNFATtgn clone 4 infiltrate that was imaged with PET (C).

