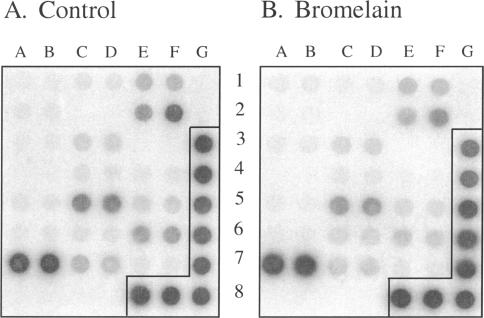
Figure 5.
Transcriptional profiling following bromelain treatment. Gene expression profiles of control (A) and bromelain-treated (24 hours) AN1/lacZ human glioma cells (B) in a cancer/metastasis GEArray. Probes were prepared using RT-PCR techniques and hybridized to membrane genes involved in tumor cell adhesion and genes for proteolysis of ECM during tumor cell invasion. Following extensive washing, membranes were exposed to a phosphoimager to capture an image. No large variations in gene expression were detected following the bromelain treatment. The α3 integrin and CD44 are located, respectively, at 5C, 5D and 1E, 1F. The two housekeeping genes actin and GAPDH are located, respectively, at 3G, 4G and 5G, 6G, 7G, 8E, 8F, 8G, whereas the negative control (pUC18, bacterial plasmid) is located at 1G, 2G. The signals were found to be within the linear range of exposure.

