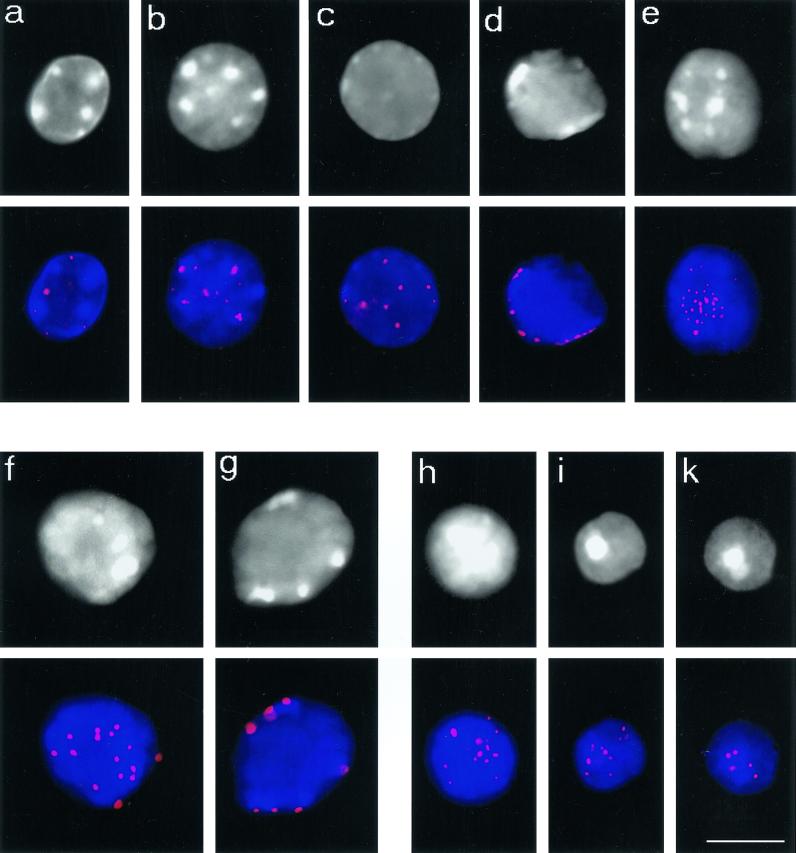
Figure 3.
Telomere redistribution during mouse spermatogenesis as displayed by Trf1 immunofluorescence (Cy3, red). Staging was deduced from stage-specific heterochromatin and telomere distribution patterns (see Scherthan et al., 1996). DAPI staining of nuclear DNA is given at the top (gray). DAPI-bright heterochromatin is seen as whitish clusters. (a) Nucleus of a spermatogonium with dispersed telomere distribution. (b) Premeiotic nucleus with prominent intranuclear heterochromatin clusters and dispersed telomeric Trf1 signals. (c) Preleptotene nucleus with faint peripheral heterochromatin and scattered Trf1 telomere signals (d) Late preleptotene nucleus displaying exclusively perinuclear telomere distribution. Note the small telomere signals, compared with f and g. (e) Top of bouquet nucleus (corresponding to leptotene/zygotene) with clustered telomeres. Small Trf1 signal diameter indicates that most telomeres have not yet paired. (f and g) Pachytene nuclei as identified by prominent peripheral heterochromatin clusters and large peripheral telomere signals. (f) Top of pachytene nucleus with numerous signals. (g) Focal plane at maximum diameter of a pachytene nucleus displaying Trf1 signals at the nuclear envelope. (h-k) Haploid round spermatids showing Trf1 telomere signals at the DAPI-bright heterochromatin chromocenters over the central region of the spermatid nuclei. Bar: 10 μm, it applies to all details.

