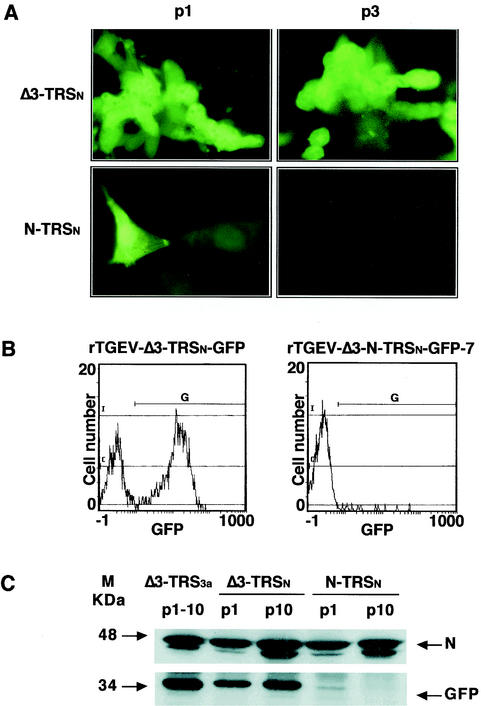
FIG. 7.
Analysis of GFP protein expressed by recombinant viruses rTGEV-Δ3-TRSn-GFP and rTGEV-Δ3-N-TRSn-GFP-7. (A) GFP expression observed by fluorescence microscopy at passages 1 (p1) and 3 (p3) in cell cultures infected with rTGEV-Δ3-TRSn-GFP (Δ3-TRSn) or rTGEV-Δ3-N-TRSn-GFP-7 (N-TRSn). (B) Flow cytometry analysis of GFP expression in swine testis cells infected (passage 1) with rTGEV-Δ3-TRSn-GFP or rTGEV-Δ3-N-TRSn-GFP-7. G represents the GFP-positive cell population. Green fluorescence intensity (GFP) is revealed on the x axis. (C) Western blot analysis of the GFP protein expressed by rTGEV-Δ3-TRSn-GFP (Δ3-TRSn) or rTGEV-Δ3-N-TRSn-GFP-7. (N-TRSn) in infected swine testis cells. Cell lysates from passages 1 (p1) and 10 (p10) were separated by SDS-PAGE under reducing conditions and probed with monoclonal antibodies specific for the viral N protein (upper panel) or GFP (lower panel). Δ3-TRS3a, GFP expressed in extracts from rTGEV-Δ3-TRS3a-GFP-infected swine testis cells from passages 1 to 10 (p1 to p10). The molecular mass is indicated on the left.

