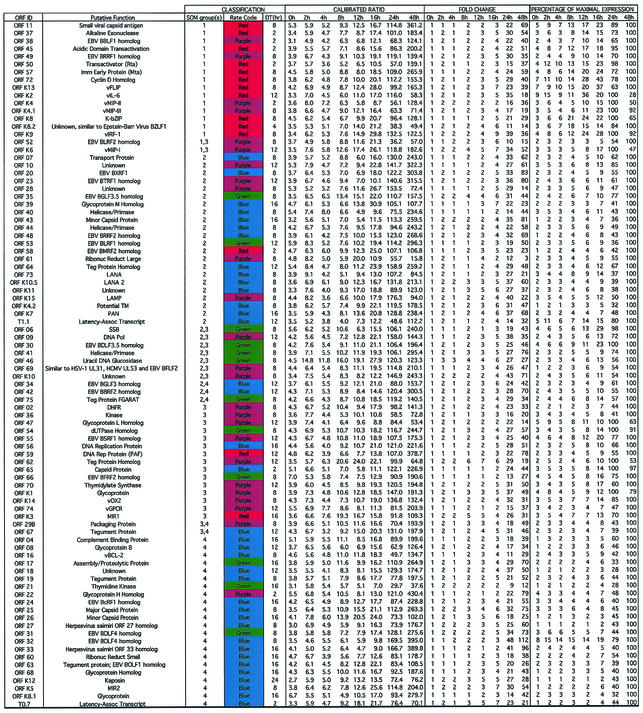
TABLE 4.
Summary of analyzed data for Rta-induced KSHV genesa
Viral genes are listed according to SOM group order. Duplicate spotted genes’ calibrated ratios that were split between two groups were placed near the closest SOM group. The color codes represent the gene’s respective rate profiles described in the text and shown in Fig. 7. DT, time of first expressional doubling with respect to baseline expression at time zero. The quantitative data (from left to right) represent the respective average calibrated Rta/empty-vector ratios for each gene at each hour collected post-Dox addition; the change measured by each gene’s expression at each time point (CalRatio) divided by its time zero baseline expression (CalRatio); and the percentage of maximum expression measured by each gene’s change at each time point divided by its respective maximum change (set at 100).

