
Figure 1.
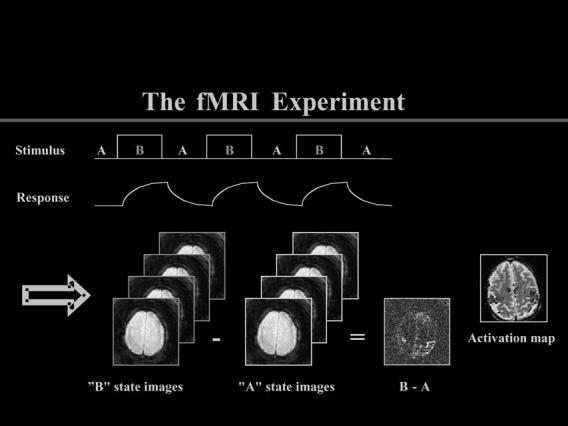
Experimental (“B” state) images are subtracted from control (“A” state) images to achieve regional activation maps with fMRI. (Courtesy of Gary H. Glover, Lucas MRS/MRI Center, Stanford University)
Official websites use .gov
A
.gov website belongs to an official
government organization in the United States.
Secure .gov websites use HTTPS
A lock (
) or https:// means you've safely
connected to the .gov website. Share sensitive
information only on official, secure websites.
Experimental (“B” state) images are subtracted from control (“A” state) images to achieve regional activation maps with fMRI. (Courtesy of Gary H. Glover, Lucas MRS/MRI Center, Stanford University)