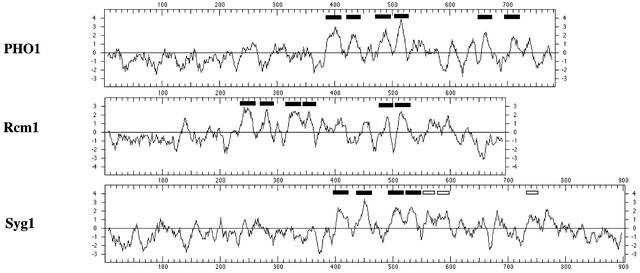
Figure 3.
Hydropathy Profiles of PHO1, Rcm1, and Syg1.
Evaluation of the potential transmembrane-spanning domains was performed using the program TMHMM2.0 (Krogh et al., 2001; http://www.cbs.dtu.dk/services/TMHMM/) and was transposed on a Kyte-Doolittle plot using a window of 11 amino acids. Transmembrane segments having a probability score of at least 1.0 are indicated by closed rectangles, whereas those having a probability score between 0.5 and 1.0 are indicated by open rectangles.

