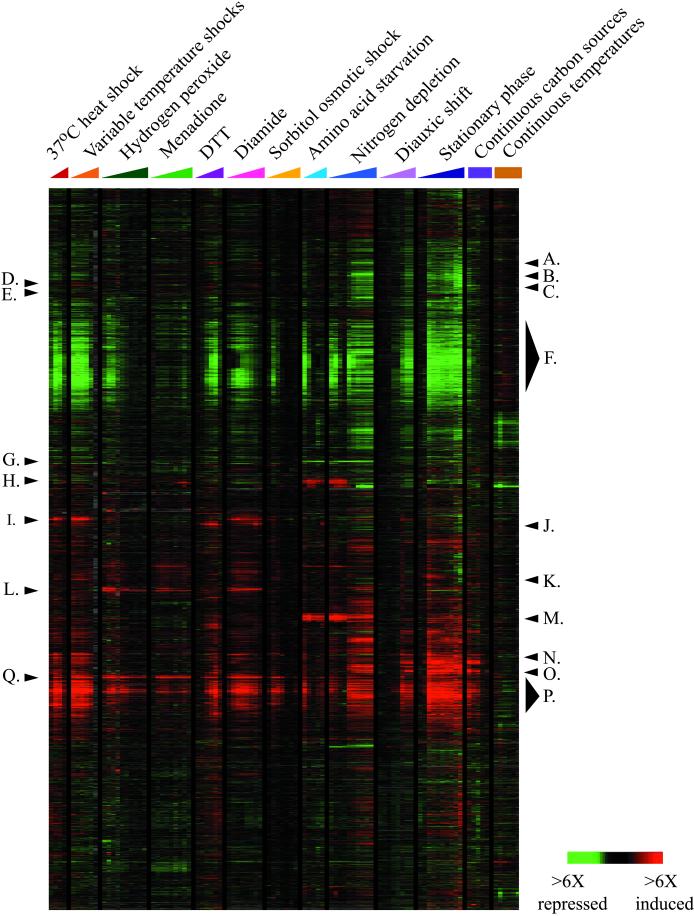
Figure 1.
Genomic expression programs in response to environmental changes. The entire set of yeast genes identified at the time of our analysis (∼6,200) was clustered based on their expression patterns in 142 array experiments that followed wild-type yeast responding to environmental changes. Here, data from 94 arrays are shown, omitting duplicate experiments that were considered in the clustering analysis (see web supplemental MATERIALS AND METHODS for details). Experiments are labeled according to the color key depicted: time course experiments are indicated with colored triangles, while steady-state experiments are labeled with colored squares. Individual clusters of coregulated genes that are discussed in the text and web supplements are labeled as follows: A. WSC2 cluster, B. CIS3 cluster, C. LHS1 cluster, D. Glycolysis cluster, E. SSA2 cluster, F. Repressed ESR cluster, G. Amino acid transporters, H. Amino acid and purine genes, I. Chaperone cluster, J. KAR2 cluster, K. Proteasome and Endocytosis cluster L. TRR1 and TRR2 clusters, M. DAL cluster, N. Oxidative phosphorylation cluster, O. Glyoxylate and TCA cycle cluster, P. Induced ESR cluster, Q. TRX2 cluster.

