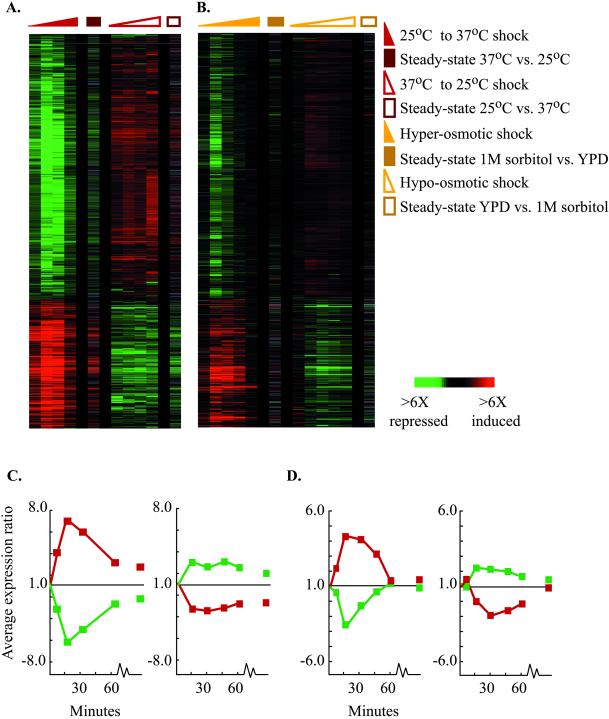
Figure 6.
Reciprocal expression of the ESR following reciprocal environmental changes. (A-B) The expression of ESR genes is shown for (A) cells transferred from 25°C to 37°C (▴) and cells transferred from 37°C to 25°C (▵), and (B) cells exposed to hyper-osmotic shock (▴) and reverse osmotic shock (▵) over the course of 1 h. Steady-state expression at each condition is also shown and is indicated by a closed or open square. The genes represented are the same as those shown in Figure 3. (C-D) The average expression changes of genes displayed in (A) and (B), respectively, over time are graphed. Genes normally induced in the ESR are represented by a red curve, and genes normally repressed in the ESR are represented by a green curve on each plot.

