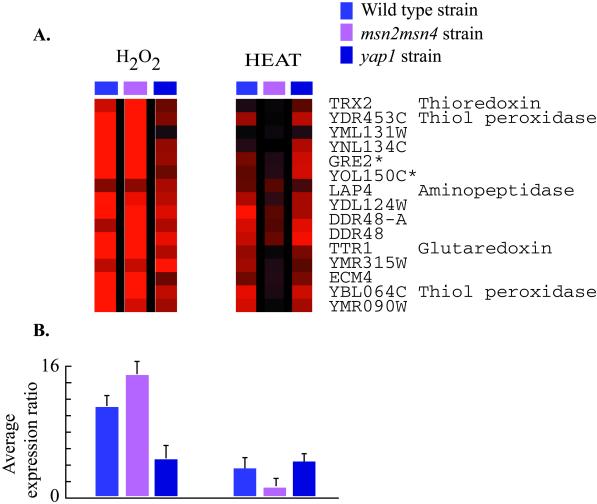
Figure 8.
ESR genes dependent on Msn2/Msn4p and Yap1p. (A) Gene expression in the wild-type, msn2 msn4, and yap1 strains was monitored following heat shock and H2O2 treatment as described. The expression ratios for each gene in this diagram represent the average from duplicate array experiments. Transcripts of the GRE2 and YOL150C genes (*) are highly homologous and are likely to cross-hybridize on the microarrays. (B) The bar graphs depict the average change in expression for the genes shown in (A) in each of the strains tested.

