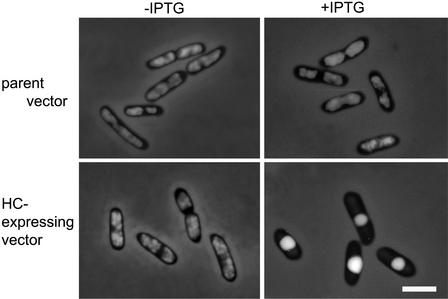
Figure 9.
Fluorescence and Phase-Contrast Micrographs of the Effect of HC Protein on E. coli Nucleoid Structure.
E. coli cells carrying pQE50 (parent vector) or pQE50-CmhupA (HC-expressing vector) were fixed in 0.5% glutaraldehyde, stained with 1.0 μg/mL DAPI, and visualized by phase-contrast and fluorescence microscopy. Left column shows cells before induction (−IPTG), and right column shows cells after induction (+IPTG). Bar = 3 μm for all panels.

