Figure 7.
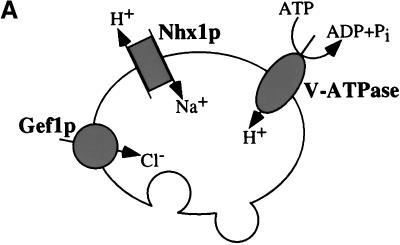
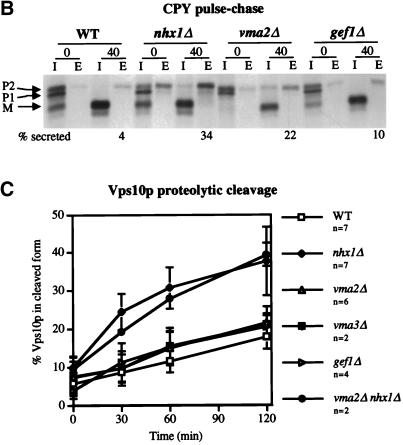
Analysis of the trafficking defect of vmaΔ and gef1Δ cells. (A) Proposed ion transporters of the PVC. The V-ATPase actively pumps protons into the PVC, while Nhx1p passively exchanges sodium ions for protons driven by ion gradients across the membrane. Gef1p is a putative voltage-gated ion channel thought to transport chloride ions into the PVC. (B) CPY processing and secretion. Wild-type (RPY10), nhx1Δ (KEBY13), vma2Δ (KEBY27), and gef1Δ cells (KEBY32) were labeled with [35S]methionine and cysteine for 10 min and then chased for 0 or 40 min at 30°C. CPY was immunoprecipitated as described in Figure 1, and in the MATERIALS AND METHODS. The amount of CPY secreted after a 40-min chase was quantified by using phosphoimager analysis, and is shown underneath the gel. The % CPY secreted for each strain is the average value obtained over several independent experiments (7 for WT and nhx1Δ, 3 for vma2Δ, and 2 for gef1Δ). (C) Proteolytic cleavage of Vps10p. Wild-type (RPY10), nhx1Δ (KEBY13), vma2Δ (KEBY27), vma3Δ (KEBY29 with pTS18), gef1Δ cells (KEBY32), and nhx1Δ vma2Δ cells (KEBY35) were metabolically labeled as described above and chased for 0, 30, 60, or 120 min. Vps10p immunoprecipitates were separated on a SDS polyacrylamide gel, which was exposed to a phosphoimager screen and the band intensities quantified. The amount of the lower, cleaved form of Vps10p (*) was calculated as a percentage of total Vps10p at each time point. Each point on the graph represents the mean of several independent experiments (n = number of experiments), and the error bars represent SDs from the mean.


