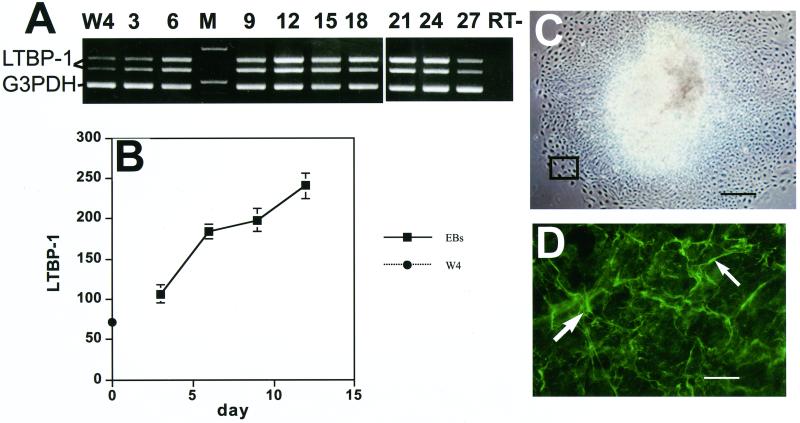
Figure 1.
LTBP-1 expression by differentiating EBs. (A) RT-PCR analysis (days after plating). The two upper bands of 800 and 600 base pairs (bp) represent the two alternatively spliced isoforms of LTBP-1; the lowest band of 400 bp corresponds to the housekeeping gene G3PDH. The lane marked RT− represents the sample incubated in the absence of reverse transcriptase. M, markers for 1 and 0.5 kb. (B) Densitometric analysis of gel bands. The values from four different gels each representing a separate experiment were averaged. The values represent the percentages of the value for the two LTBP-1 bands versus the value for the housekeeping gene G3PDH for each lane. (C) Phase microscopy image (×40) of a 3-d-old EB. The outlined rectangle corresponds to the image shown in D. Bar, 250 μm. (D) Immunofluorescent staining of a 3-d-old EB with anti-LTBP-1 rabbit antiserum. White arrows show extracellular LTBP-1 fibers. Magnification, ×400. Bar, 25 μm.

