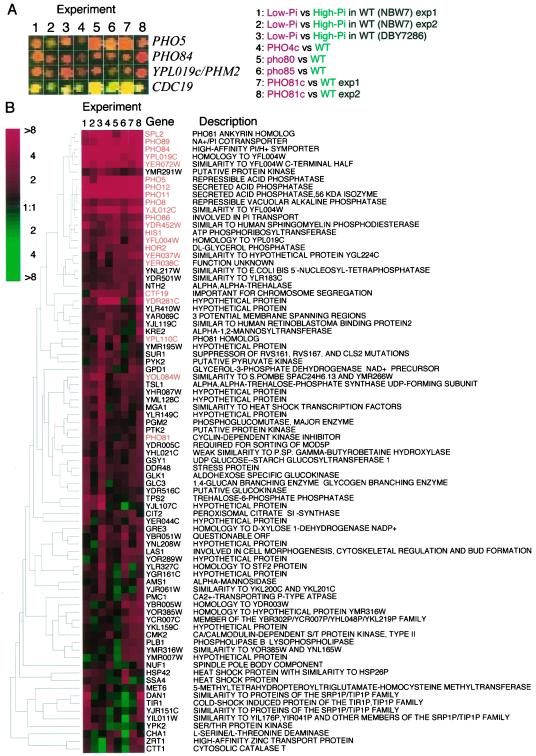
Figure 2.
DNA microarray analysis. (A) Fluorescent scanning images of the spots for the typical PHO-regulated genes, PHO5, PHO84, and YPL019c/PHM2, and a non PHO-regulated gene, CDC19. The column number indicates experiments performed as follows, 1 and 2: comparison between NBW7 (wild-type) cultivated in low- (YPAD-Pi, Cy5) and high-Pi media (YPAD+Pi, Cy3); 3: DBY7286 (wild-type) cultivated in low- (YPAD-Pi, Cy5) and high-Pi media (YPAD+Pi, Cy3); 4: comparison between NBD82–1 (PHO4c-1, Cy5) and NBW7 (Cy3); 5: comparison between NBD80–1 (pho80Δ, Cy5) and NBW7 (Cy3); 6: comparison between NBD85A-1 (pho85Δ, Cy5) and NBW7 (Cy3); 7 and 8: comparison between NOF1 (PHO81c-1, Cy5) and NBW7 (Cy3). All strains used in experiment 4, 5, 6, 7, and 8 were cultivated in YPAD media. (B) Cluster analysis of the DNA microarray data. Eight independent DNA microarray data were analyzed the Cluster program (Eisen et al., 1998). Genes showing more than twofold induction in any experiments correspond to the rows, and the experiments are the columns. Red represents a higher level of expression in the low-Pi conditioned wild-type cells compared with the high-Pi conditioned cells or in the mutant strains compared with the wild-type strains. The color saturation represents the magnitude of the expression ratio, as indicated by the scale at the top left of the figure. Black indicates no detectable difference in expression levels; gray denotes a missing observation. The rows, representing series of observation on individual genes, were ordered based on the similarity of their expression patterns in the eight experiments (Eisen et al., 1998). The dendrogram to the left of the figure represents the correlation between expression patterns, as described by Eisen et al., (1998). Names of the genes listed in Table 2 are emphasized by red color.

