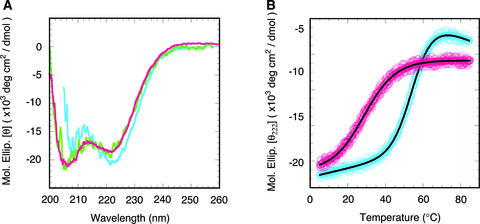
Figure 6.
Secondary Structure and Thermal Stability of ARR10-B.
(A) CD spectra of 7.4 μM (green) and 27 μM (magenta) free ARR10-B in 10 mM sodium phosphate buffer, pH 7.0, and of 40 μM ARR10-B bound with DNA 2 (blue) in the same buffer containing 160 mM NaCl. The spectrum of the DNA-bound form of ARR10-B was obtained by subtracting the spectrum of DNA 2 from that of the mixture of ARR10-B and DNA 2.
(B) Thermal denaturation curves of the free and DNA-bound forms of ARR10-B. The curve of the free form (magenta circles) was measured for the solution containing 27 μM polypeptide. The curve of the DNA-bound form (blue circles) was obtained by subtracting the curve of DNA 2 from that of the mixture of ARR10-B and DNA 2 at a protein concentration of 40 μM. The solid lines are the best fits to the experimental data based on a two-state model.

