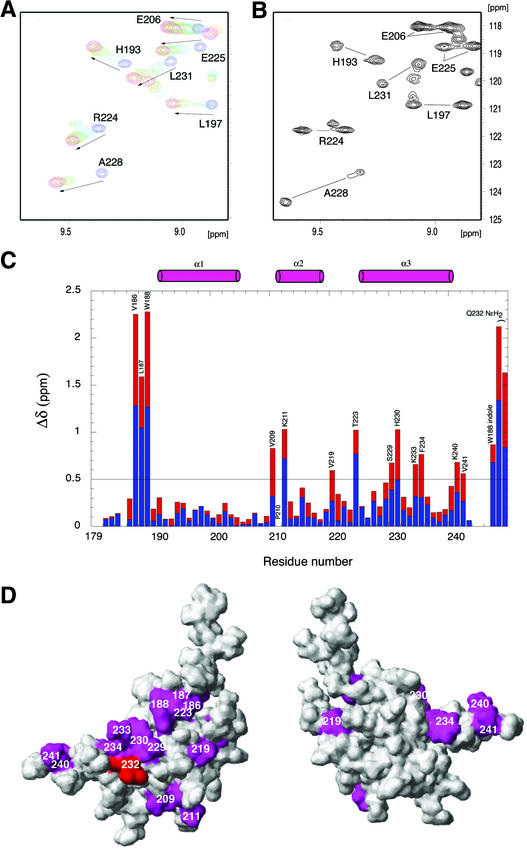
Figure 8.
NMR Chemical Shift Perturbation of ARR10-B upon Binding to DNA.
(A) Overlay of a selected region of the 1H-15N HSQC spectra obtained at 15°C of ARR10-B in the absence and presence of DNA 1, providing evidence that the binding of ARR10-B to DNA 1 is in fast exchange on the NMR time scale. The arrows show the direction of shifts. ARR10-B/DNA 1 = 1:0 (blue), 1:0.5 (aqua), 1:1 (green), 1:1.5 (orange), and 1:2.5 (magenta).
(B) Selected region of the single 1H-15N HSQC spectrum obtained at 15°C of ARR10-B in the presence of 0.3 equivalents of DNA 2, which shows two sets of ARR10-B amide signals from the free and DNA-bound forms in slow exchange.
(C) Changes in the NMR chemical shifts of ARR10-B induced by complex formation with DNA 2 and calculated with the function Δδ = |ΔδHN (blue)| + |0.17Δδ15N (red)|. The positions of the α-helices are indicated schematically as cylinders at the top of the figure.
(D) Two views of the ARR10-B surface colored magenta to indicate residues whose backbone amide chemical shifts were most sensitive (chemical shift perturbations Δδ > 0.5 ppm) to binding with DNA 2. Note that the side chain of Glu-54, shown in red, was perturbed. The left view is in the same orientation as Figure 7A, whereas the right view was obtained by ∼180° clockwise rotation about the vertical axis.

