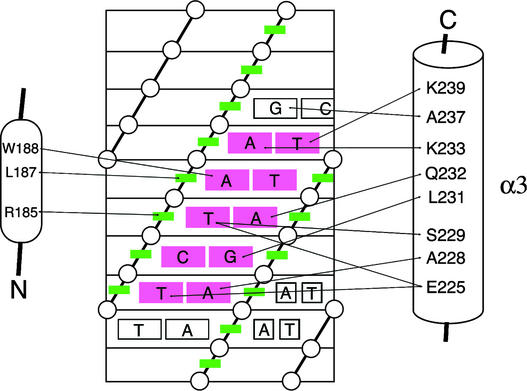
Figure 9.
Scheme of the ARR10-B–DNA Interactions.
The contacts were derived from intermolecular NOEs between ARR10 and DNA 2. The DNA is represented as a cylindrical projection with phosphates indicated by circles and sugar rings indicated by green boxes. The critical AGATT base pairs are shown in red.

