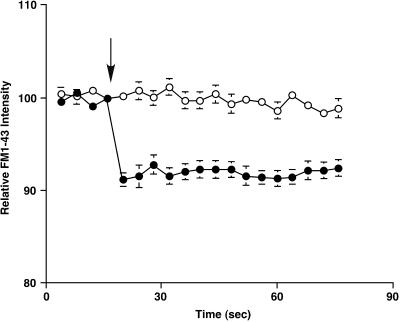
Figure 2.
FM 1–43 destaining after wounds in 1.8 mM Ca2+ Ringer's solution (filled circles) and 0.1 mM Ca2+ Ringer's solution (open circles). The local fluorescent intensity around the disruption site was acquired at 4-s intervals. Each cell was wounded by a glass needle just after fourth image acquisition (arrow). Values are mean ± SE.

