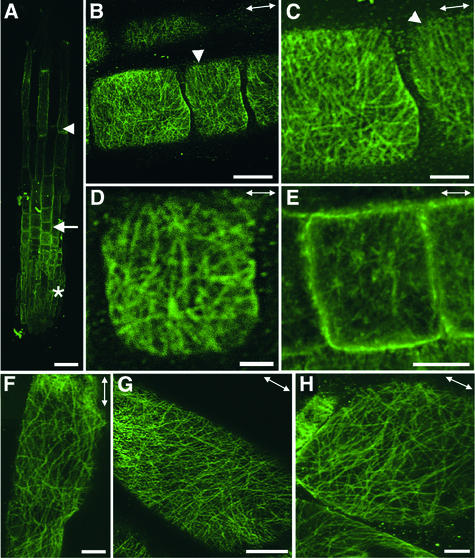
Figure 4.
Visualization of Cortical MTs in fra2 Root Epidermal Cells.
Roots of 3-day-old seedlings were used for immunofluorescent labeling of MTs, and the signals of fluorescent MTs (green) were visualized using a confocal microscope. Double-headed arrows indicate the elongation axis.
(A) View of a whole root tip showing root cap cells (asterisk), early-expanding cells (arrow), and rapidly expanding cells (arrowhead).
(B) to (E) Early-expanding cells showing aberrant orientations of cortical MTs. Note that many MTs appeared to converge at some common sites. Also note that some regions of cells had cortical MTs aligned in a nearly transverse orientation (arrowheads).
(F) to (H) Rapidly expanding cells showing aberrant orientation of cortical MTs. Note that many MTs in (H) appeared to converge at some common sites.
Bar in (A) = 40 μm; bars in (B), (E), and (G) = 8 μm; bars in (C), (F), and (H) = 4 μm; bar in (D) = 2 μm.

