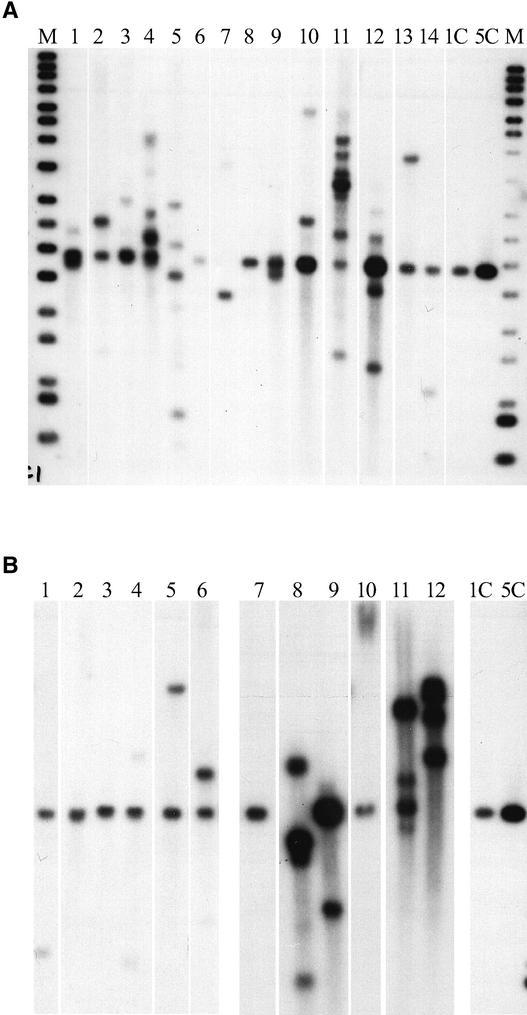
Figure 3.
DNA Gel Blot Analysis and Copy-Number Frequency Distribution for BMS Transgenic Lines.
(A) A random sample of stably transformed lines representing independent transformation events. The lines shown were from two filters from the same bombardment experiment. Lanes marked M contained molecular mass marker fragments. Lanes 1C and 5C show hybridization signals from one and five transgene copies, respectively.
(B) Copy numbers of random samples of BASTA-resistant BMS calli transformed with low-dose DNA. Lines with predominantly one or two copy numbers per genome are shown in lanes 1 to 6. High-dose DNA resulted in multiple insertions, which are shown in lanes 7 to 12. Lanes 1C and 5C are as described in (A).

