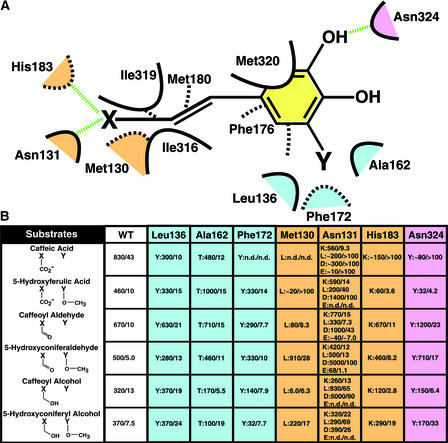
Figure 5.
Scheme and Mutagenesis Study of the Lignin Monomer Binding Site of COMT.
(A) Scheme of the lignin monomer binding site of COMT. van der Waals interactions are shown as dashed or solid curves. Hydrogen bonds are shown as dashed green lines. The spatial orientation of residues is approximate, with solid curves representing residues in the foreground and dashed curves representing residues in the background. Residues that are color coded as light blue (methoxy binding pocket), pink (hydroxyl group binding), and beige (propanoid tail binding region) constitute COMT residues selected for mutagenesis and further kinetic analysis. X represents a carboxylate moiety, a hydroxyl group, or an aldehyde moiety. Y signifies a methoxy group or the absence of any functional moiety on the phenyl ring of the putative COMT substrates.
(B) Kinetic analysis of a series of wild-type (WT) and mutant forms of COMT. The positions chosen for mutagenic replacement are color coded and correspond to the color scheme in (A). The mutations are given as single-letter amino acid codes. Each mutant is shown as mutation:Vmax/Km. All assays were performed in quadruplicate. Vmax values are given as pkat/mg COMT, and Km values are expressed in μM. n.d., no activity determined.

