Figure 3.
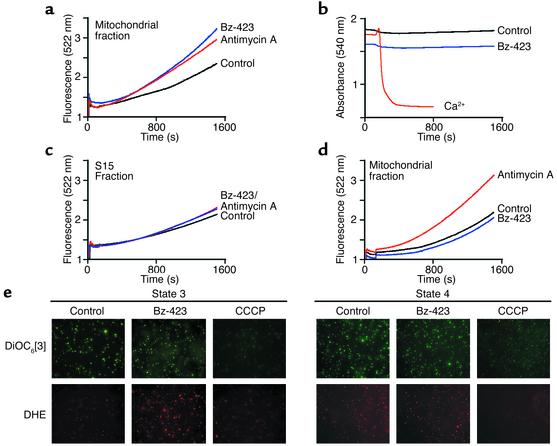
Bz-423 generates ROS but not swelling in isolated mitochondria. Measurements were conducted in duplicate as described in Methods and represent data obtained with mitochondria from four different rats. Within a given run, a larger slope corresponds to greater ROS production. For these experiments, antimycin A was added at 0.5 μM and Bz-423 at 10 μM. The r2 values for the linear regression analysis of the data in a, c, and d are greater than 0.995. (a) ROS measured in state 3 respiration buffer. The slopes of each curve after the induction phase (1,200–1,500 seconds) are 1.5 × 10⁻³ ± ≤15%, 2.1 × 10⁻³ ± ≤15%, and 1.1 × 10⁻³ ± ≤15% for antimycin A, Bz-423, and vehicle, respectively. P < 0.05 for vehicle vs. Bz-423 or antimycin A (Student’s t test). (b) Swelling of mitochondria in state 3 buffer. Only Ca2+ (400 μM) triggered the MPT pore. (c) ROS measured using the S15 fraction in state 3 buffer. Slopes are 0.9, 0.8, and 1.0 (× 10–3 ± ≤15%) for antimycin A, Bz-423, and vehicle, respectively. (d) ROS measured in state 4 respiration buffer. Slopes are 2.1, 1.3, and 1.3 (× 10–3 ± ≤15%) for antimycin A, Bz-423, and vehicle, respectively. P = 0.25 for vehicle vs. Bz-423; P = 0.035 for vehicle vs. antimycin A (Student’s t test). (e) Micrographs (×630) of mitochondria stained with DHE (red) to detect O2– or with DiOC6[3] (green) to determine ΔΨm. Each spot represents an individual mitochondrion staining with the indicated dye.

