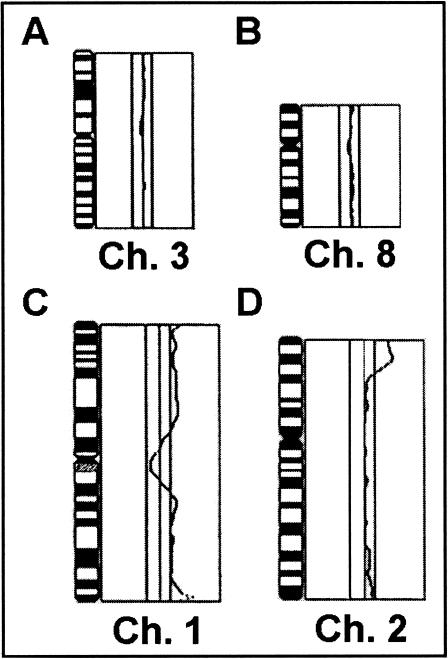
Figure 1.
Examples of CGH changes from a RMS tumor. The line in the middle of each profile indicates the base line ratio (1.0), and the lines on the left and right sides show the cut-off values of 0.80 (for loss) and 1.20 (gain), respectively. The profiles demonstrate a normal green-to-red ratio for chromosome 3 (A) and 8 (B), gain of chromosome 1 (C), and high level gain at 2p23-25 (D).

