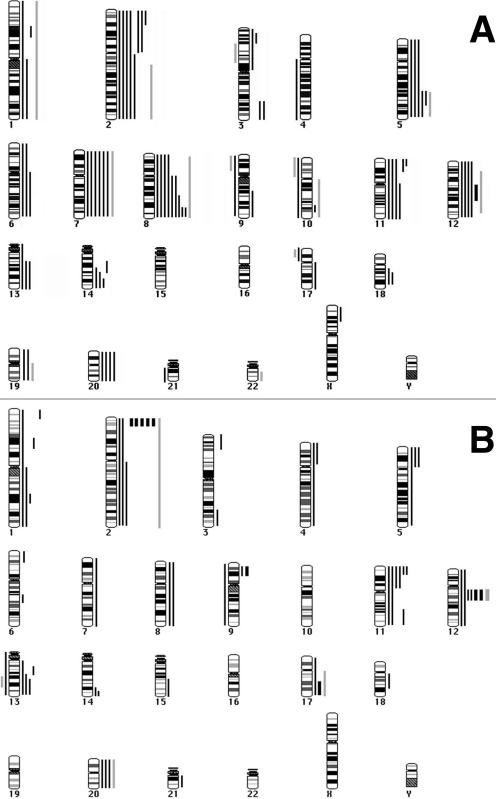
Figure 2.
Ideograms summarizing the results of CGH analysis of RMS. Gains are represented by vertical lines to the right of schematic chromosomes, whereas losses are represented by lines to the left. Solid lines indicate changes identified by using DNA derived from the 21 patient tumors, and the gray lines indicate changes identified by using DNA from the two RMS cell lines. Thicker lines to the right indicates the presence of a high copy amplification. A. CGH analysis of RMS-E. Copy number changes of 10 tumors and 1 cell line indicate a pattern of gains and gene amplification. In particular, gains of chromosomes 2, 7, 8, 11, and 12 are frequent. Only one tumor exhibited amplification (thicker solid line; chromosome 12). B. CGH Analysis of RMS-A. Copy number changes of 11 tumors and 1 cell line indicate a pattern of gains and gene amplification. High level gains/amplifications (∼>5 copy number) are illustrated by thicker lines. In contrast to RMS-E, there are fewer whole chromosome gains, and more tumors with localized gene amplification, involving both the MYCN region and, less frequently, the MDM2 region. Two other amplifications were detected, one on the short arm of chromosome 9 and one at the distal region of 17q.

