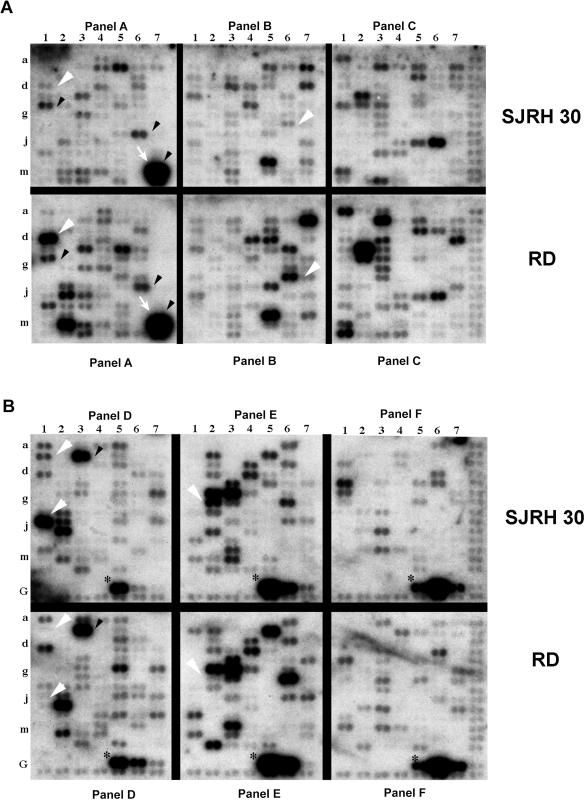
Figure 5.
The differential gene expression in RMS cell lines of RD and SJRH30 in the six different quadrants (A—Panel A–C and B—Panel D–F). Approximately 29% of the 588 genes present on the array generated readily detectable hybridization signals. Of these 77.3% was commonly expressed in the two tumor subtypes (black arrowheads), whereas 22.7% genes had dissimilar profiles (white arrowheads). Strong hybridization signals at A7m and A7n (white arrows) indicate a high expression of vimentin and desmin, respectively, which are overexpressed in rhabdomyosarcomas. Positive control housekeeping genes (*) present on the array are used by the AtlasImage software to normalize the intensity of the signals between the blots.

