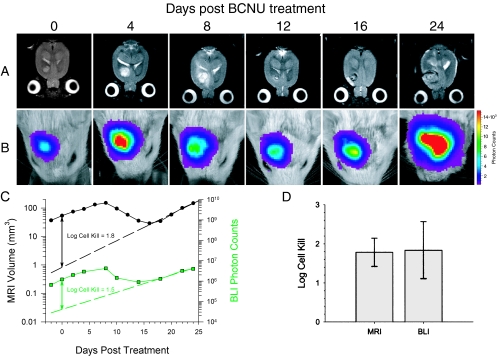
Figure 2.
Temporal analysis of the response of a 9LLuc tumor to BCNU chemotherapy. Tumor cells were implanted 16 days before treatment. Tumor volume was monitored with T2-weighted MRI (A) and intratumoral luciferase activity was monitored with BLI (B). The days post-BCNU therapy on which the images were obtained are indicated at the top. The scale to the right of the BL images describes the color map for the photon count. Quantitative analysis of tumor progression and response to BCNU chemotherapy (C). Tumor volumes (●) and total tumor photon emission (■) obtained by T2-weighted MRI and BLI, respectively, are plotted versus days post-BCNU treatment. The dashed lines are the regression fits of the exponential tumor repopulation following therapy. The solid vertical lines denote the apparent tumor-volume and photon-production losses elicited by BCNU on the day of treatment from which log cell kill values were calculated as previously described [9]. Comparison of log cell kill values determined from MRI and BLI measurements (D). Log cell kill elicited by BCNU chemotherapy was calculated using MRI (1.78±0.36) and BLI (1.84±0.73). Data are represented as mean±SEM for each animal (n=5). There was no statistically significant difference between the log kills calculated using the MRI and BLI data (P=.951).

