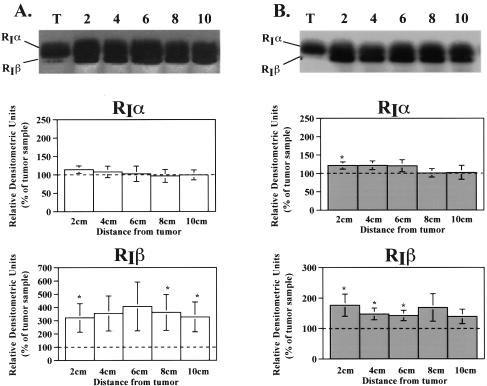
Figure 1.
Alterations in type I PKA regulatory subunit protein levels in colorectal tumors. Cellular extracts of tissue homogenates were subjected to western blot analysis as described in Materials and Methods section. A representative western blot is shown above each bar graph. Bar graphs depict densitometric analysis of RIα and RIβ subunit protein levels in (A) ascending and (B) descending specimens. Data are presented as a percentage of the amount present in the tumor and are reported as the average±SEM. RIα (ascending), n=12 for 2, 6, 8 cm, 11 for 4 cm, and 10 for 10 cm; RIα (descending), n=19 for 2, 4, 6 cm, 16 for 8 cm, and 12 for 10 cm; *P<.05 when compared to tumor value. RIβ (ascending), n=8 for 2, 6, 8 cm, and 7 for 4, 10 cm; RIβ (descending), n=13 for 2, 4, 6 cm, 11 for 8 cm, and 8 for 10 cm; *P<.05 when compared to tumor value.

