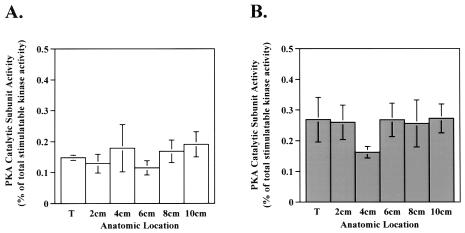
Figure 3.
PKA catalytic subunit activity is unchanged in tumor compared to adjacent mucosa. PKA catalytic subunit activity was measured in cellular extracts of tissue homogenates as described in Materials and Methods section. Bar graphs depict PKA catalytic subunit activity as a percent of the total stimulatable kinase activity in tumor and adjacent mucosa in (A) ascending and (B) descending specimens. Data are presented as the average±SEM. (A) n=6 for tumor and 7 for 2, 4, 6, 8, and 10 cm; (B) n=16 for tumor, 15 for 2, 4, 6 cm, and 11 for 10 cm; *P<.05 when compared to tumor value.

