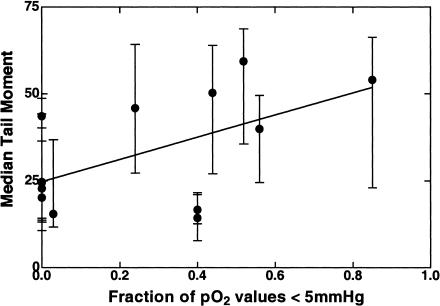
Figure 4.
The median tail moments after TPZ in the 13 human tumors in this investigation as a function of the fraction of pO2 values less than 5 mm Hg. The mean tail moment as well as the 20th and 80th percentile values of individual tumor cells are shown as an indication of the heterogeneity of the distribution of tail moments within each tumor.

