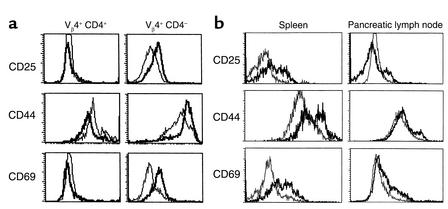
Figure 3.
Analysis of the activation state of lymphocytes from BDC2.5 mice following treatment with either poly I:C (a) or STZ (b). Cells were stained with antibody to Vβ4 TCR, CD4, and antibody to either CD25, CD44, or CD69. Cells were analyzed by FACS and compared to isotype controls. Shown are histograms of mean fluorescent intensities generated by gating on 10,000–20,000 CD4+, Vβ4+ cells, or Vβ4+, CD4– cells. (a). For both a and b, the plots are representative of one of six mice analyzed, and all six had similar results. (a) Analysis of peripheral blood lymphocytes before (narrow) and three days following poly I:C treatment (wide) from identical mouse are displayed. No shift of activation is observed in the Vβ4+, CD4+ T cell population while activation is observed in the Vβ4+, CD4– (CD8+) T cell population posttreatment (PT). Changes in cell populations and gated markers CD4+, Vβ4+: CD25, 5.7% to 7.2%; CD44-high, 28.6% to 25.2%; CD69, 6.7% to 6.9% and CD4–, Vβ4+: CD25, 2.9% to 27.8%; CD 44-high, 22.9% to 65.0%; CD69, 10.7% to 41.8%. (b) Analysis of lymphocytes from the spleen and pancreatic lymph node before (narrow) and seven days following STZ treatment (wide) are displayed. Mice were analyzed at three, five, and seven days PT. Similar results were observed at five days, but not at three days. A dramatic shift in all three activation markers was observed in the spleen PT. A less dramatic shift was observed in the pancreatic lymph node.Changes in cell populations and gated markers in spleen CD4+ Vβ4+ : CD25, 10.4% to 32.9%; CD44-high, 19.8% to 56.5%; CD69, 9.0% to 32.3%; and in pancreatic lymph nodes, CD4+ Vβ4+ : CD25, 5.4% to 25.3%; CD44-high, 7.2% to 18.9%; CD69, 8.7% to 27.0%.

