
Figure 1.
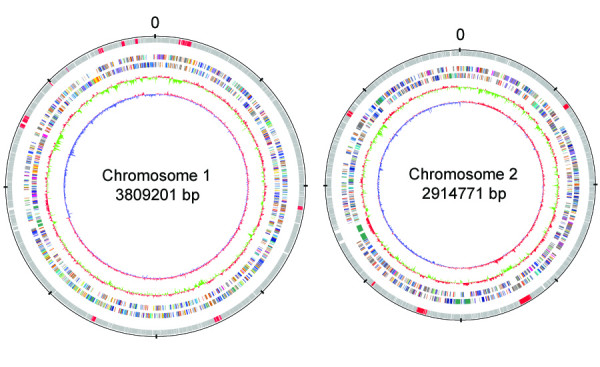
Schematic circular diagrams of the large and small chromosomes of the B. thailandensis genome. From outside to inside: scale; annotated CDSs, GIs represented by red; B. thailandensis COG categories (two circles), mean centered GC% content plot (red-high GC%, green-low GC%); mean centered (G-C)/(G+C) deviation plot (red-above mean, blue-below mean). Color coding for COG functions: gold, translation; orange, replication and transcription; yellow, nuclear structure; pink, defense mechanisms; tomato, signal transduction mechanisms; peachpuff, cell envelope biogenesis, outer membrane; purple, cell motility and secretion; red, cytoskeleton; green, extracellular structures; royalblue, energy metabolim; blue, central metabolism; aquamarine, secondary metabolism; gray, function unknown.