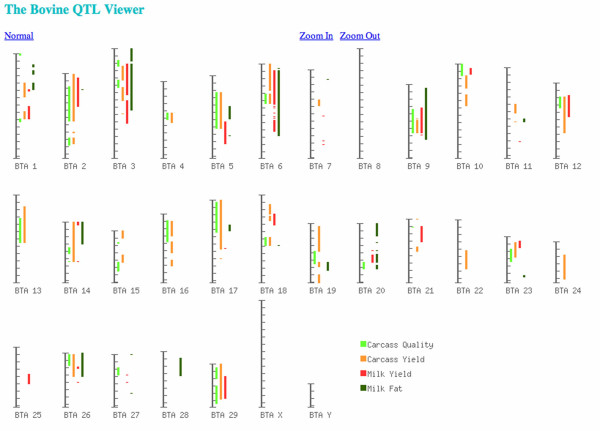
Figure 2.

Genome view of multiple QTL. This screen shot shows the result of a query for QTL for carcass quality, carcass yield, milk yield and milk fat traits. The QTL regions are color coded and for ease of viewing multiple, overlapping QTL for any single trait are collapsed into a single color coded line. By selecting a single QTL line with the mouse, the user is able to transition to the single chromosome view, where all individual QTL are displayed (see Figure 3).
