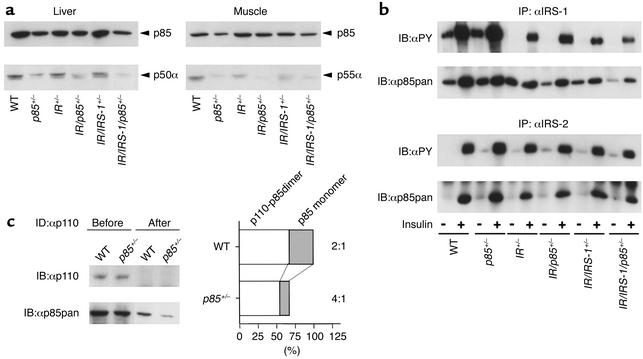
Figure 2.
Signaling molecules involved in activation of PI 3-kinase by insulin. (a) Expression levels of Pik3r1 gene products were determined in lysates from liver (left) and skeletal muscle (right) by Western blotting with an anti-p85pan antibody (αp85pan). (b) Tyrosine phosphorylation of IRS proteins and association with p85 were determined using lysates from liver of the indicated animals. Proteins were immunoprecipitated with anti–IRS-1 antibody (αIRS-1) (top two panels) or anti–IRS-2 antibody (αIRS-2) (bottom two panels), and blotted with anti-phosphotyrosine antibody (αPY) or αp85pan. (c) To determine the molecular balance between p85 and p110, the liver lysates were subjected to three sequential rounds of immunodepletion using αp110, followed by Western blotting with αp110 (left top panel) or αp85pan (left bottom panel). The amount of the p85-p110 dimer and the p85 monomer was expressed as the ratio to the value of the amount of the p85 monomer in the wild-type cells. In the graph, each bar represents the ratio to the total p85 in wild-type cells (open bar, p85-p110 dimer; dotted bar, p85 monomer).

