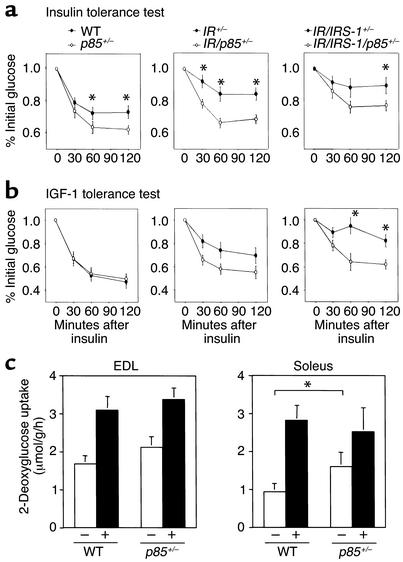
Figure 6.
Increased insulin sensitivity in the Pik3r1 mutant groups. (a) Insulin tolerance tests (1 U/kg, intraperitoneally) and (b) IGF-1 tolerance tests (1 mg/kg, intraperitoneally) were performed on 6-month-old male mice of the indicated genotypes. Results represent the blood glucose concentration as a percentage of the starting glucose value and are expressed as mean ± SEM (n = 12–30 mice per genotype). *P < 0.05, wild-type vs. p85+/–; IR+/– vs. IR/p85+/–; IR/IRS-1+/– vs. IR/IRS-1/p85+/–. (c) Glucose transport activity in isolated skeletal muscle of the Pik3r1 mutant mice was estimated using 2-deoxyglucose uptake in isolated EDL and soleus muscles as described in Methods. Results are expressed as mean ± SEM (n = 4). *P < 0.05, wild-type vs. p85+/–.

