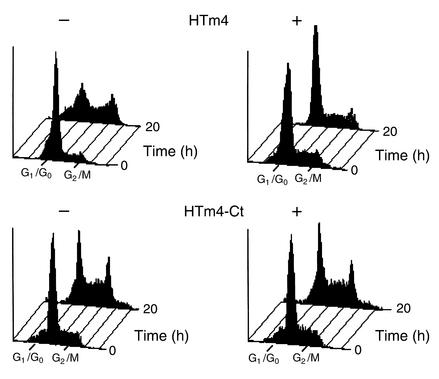
Figure 5.
Cell cycle arrest is induced by the exogenous expression of HTm4. The upper panels are U937 with inducible Flag-HTm4 expression vector and the lower panels are with Flag-HTm4-Ct. +, induction of expression in the absence of Dox; –, no induction in the presence of Dox. Time intervals are given on the right. 0 hours, before the addition of FBS into the cultures; 20 hours, cells were cultured in the presence of serum for 20 hours after synchronization. X axis shows cell cycle phase analyzed. Marked here are G0/G1 and G2/M; in between (not marked) is S phase. Representative figures of at least five experiments.

