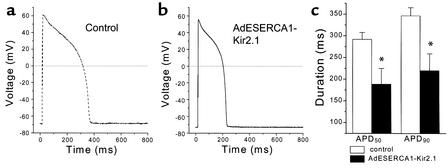
Figure 6.
APD. (a and b) Representative action potentials elicited in control and AdESERCA1-Kir2.1–infected myocytes. AdESERCA1-Kir2.1 infection abbreviated the AP. (c) Average APD50 and APD90 data are summarized (n = 8 for AdESERCA1-Kir2.1 group, and n = 13 for control). *P < 0.05, AdESERCA1-Kir2.1 versus control, t test.

