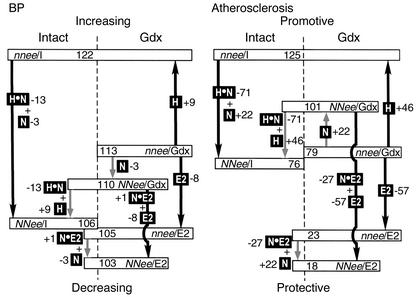
Figure 4.
Path diagram: contribution of sex hormones, eNOS, and their interactions to BP (left panel) and atherosclerotic lesion size (right panel) in Apoe–/– mice. Average BP (in mmHg) and plaque size (in μm2 × 103) of the six groups of animals are indicated in rectangles and placed on the vertical scale. Black boxes indicate the presence of different components. H indicates hormone effects in the absence of eNOS, N indicates eNOS effects in the absence of sex hormones, E2 indicates exogenous E2 effects in the absence of eNOS and endogenous sex hormones, H•N indicates interaction between endogenous sex hormones and eNOS, and N•E2 indicates the interaction between eNOS and exogenous E2. Black arrows indicate statistically significant differences, and gray arrows indicate nonsignificant differences. Numbers next to black boxes represent the contribution of each effect on increasing or decreasing BP and lesion size.

