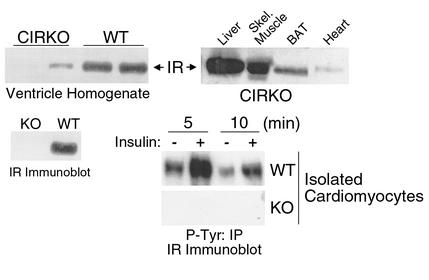
Figure 1.
Insulin receptor (IR) levels and IR autophosphorylation in CIRKO mice. Upper panels show representative immunoblots blotted for the IR in various tissues of CIRKO mice (right), and homogenates of cardiac ventricles from CIRKO and wild-type (WT) mice (left). Lower panels show a representative immunoblot for the IR from isolated cardiomyocytes obtained from CIRKO (KO) and WT mice (left), and a phosphotyrosine (P-Tyr) immunoprecipitate showing IR phosphorylation in cardiomyocytes from WT and KO mice following insulin stimulation (right). Data are from 8- to 12-week-old male mice and are representative of three to four experiments on separate animals. BAT, brown adipose tissue.

