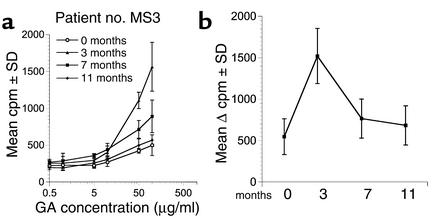
Figure 4.
Kinetics of conventional 3H-thymidine–based GA-specific proliferation during therapy. Conventional 3H-thymidine–based proliferation assays were performed on longitudinal PBMC specimens obtained from MS patients on daily GA therapy. (a) The GA-specific dose-response curves are from a representative patient (no. MS3) at the pretreatment time point and at 3, 7, and 11 months after the initiation of GA therapy, as indicated. The cpm ± SD are plotted on the y axis and the concentration of GA is plotted on the x axis (logarithmic scale). (b) The mean Δ cpm (background subtracted) ± SEM from four GA-treated patients are shown at the time points indicated on the x axis (GA at 50 μg/ml).

